The only measurement that matters is greenhouse-gas emissions—and they continued to rise.
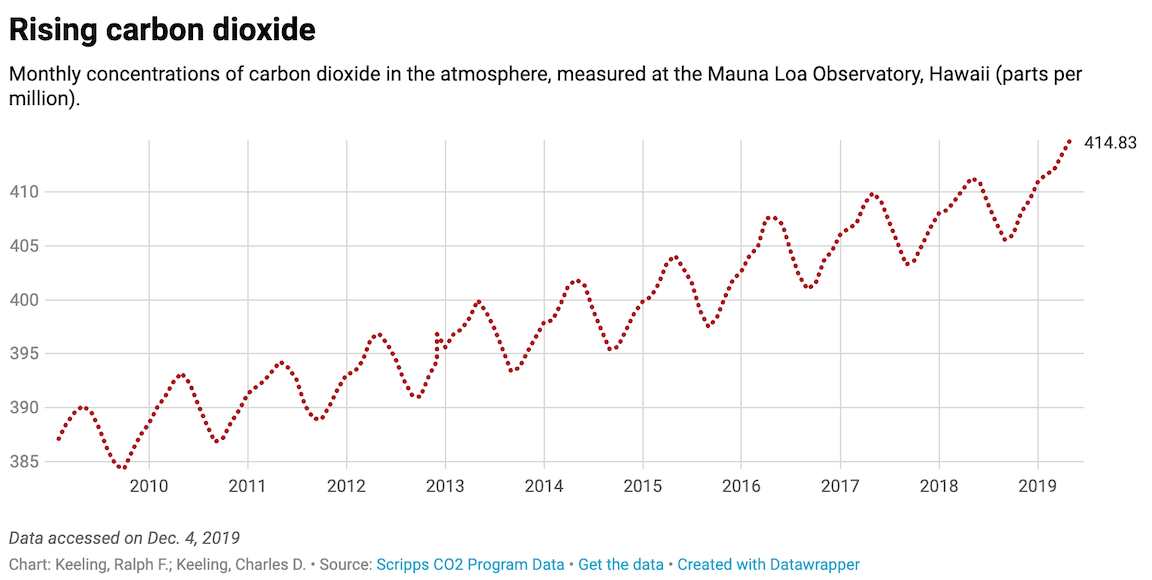
These trends, plus additional emissions from land-use changes and other human activities, added up to steadily rising carbon dioxide concentrations in the atmosphere throughout the 2010s.
Reaching the peak
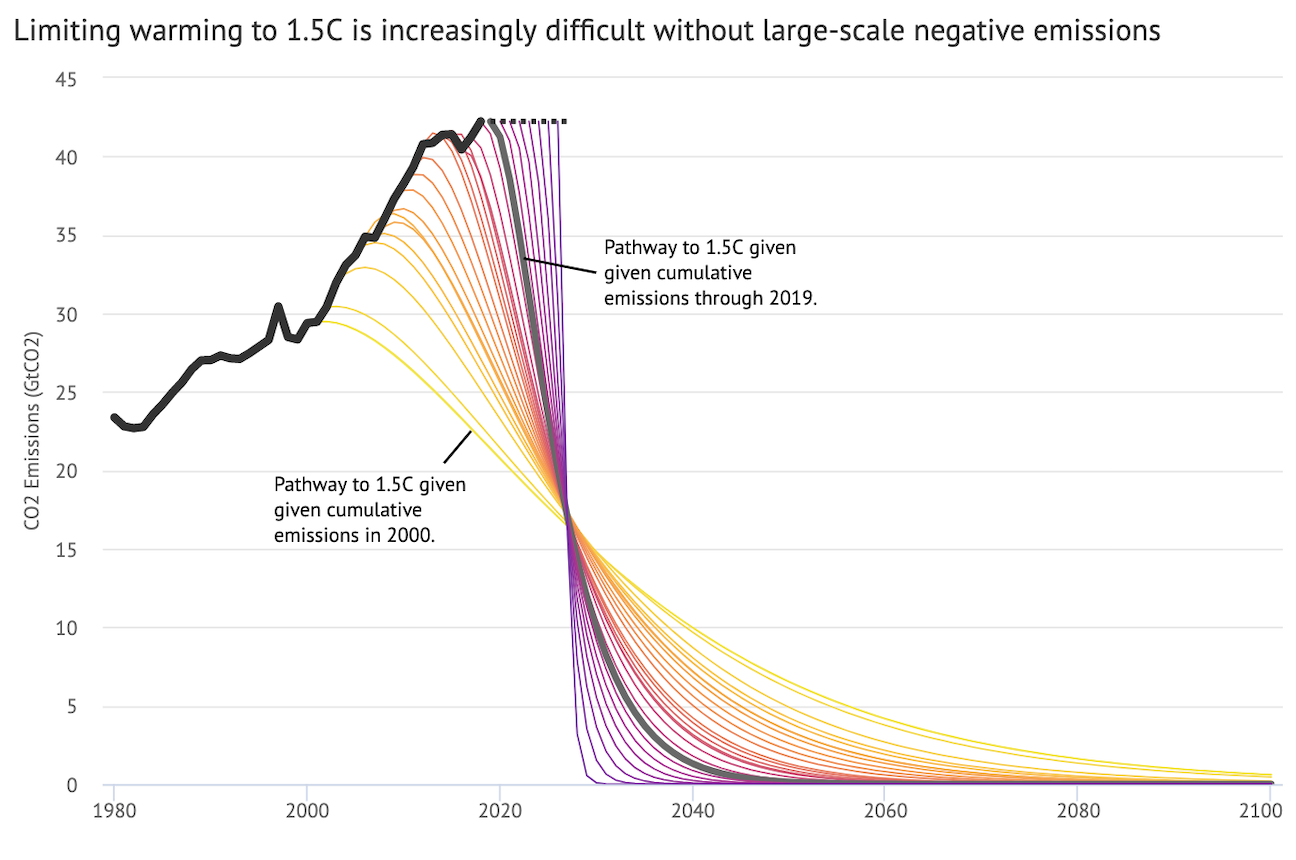
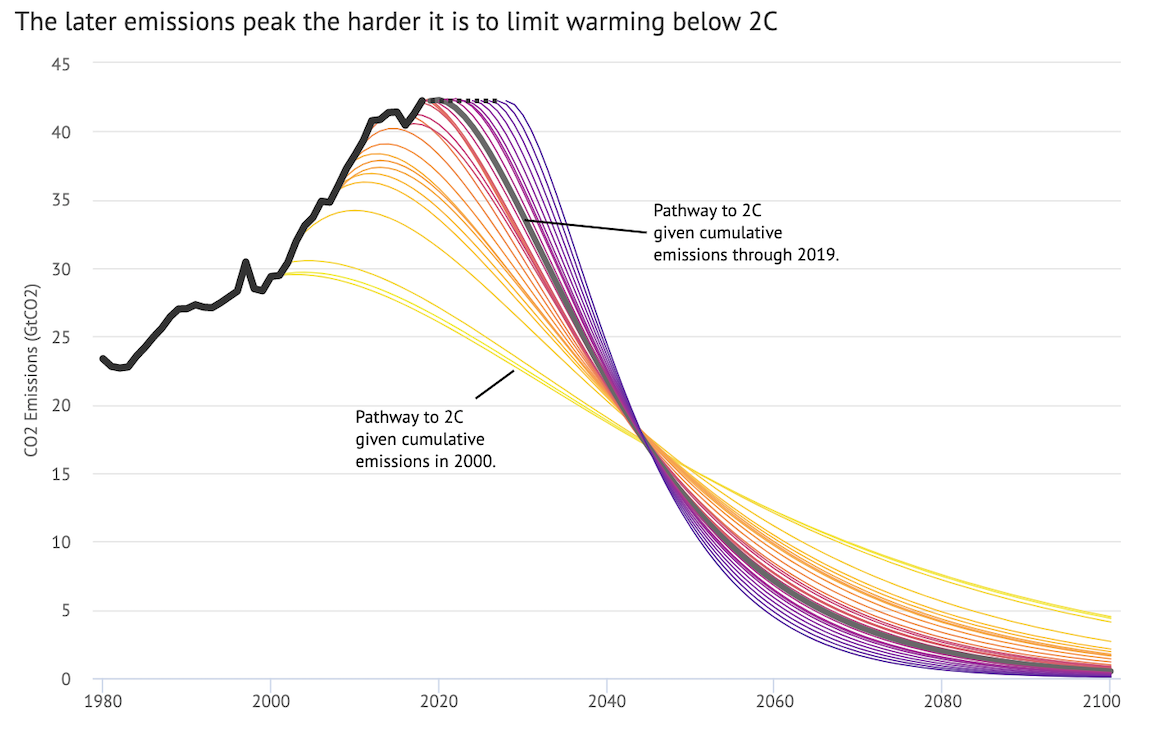
When we reach peak emissions matters. The longer we take, the deeper we’ll need to cut carbon pollution in the coming years if we hope to avoid dangerous warming thresholds, as the charts below show.
To get a sense of how much harder we’ve made the job of halting warming at 1.5 ˚C by frittering away the last decade, click on the chart and compare the steepness of the slope shown if we had plateaued in 2010 with what is projected should we reach the peak in 2020.
(These charts were produced by Zeke Hausfather for Carbon Brief, using data and the original figure from Robbie Andrew at the Center for International Climate Research.)
We’ll have to radically accelerate emissions reductions to have any hope of limiting warming to 2 ˚C as well.
In addition to aggressive emissions cuts, most models now find we’ll also need to use trees, plants and other methods to remove and store vast amounts of carbon dioxide from the atmosphere to stay below these temperature targets. But achieving these so called “negative emissions” on a large-enough scale will be incredibly costly, and compete directly with other crucial land-uses, most notably the farming needed to feed a growing global population.
Environmental impacts
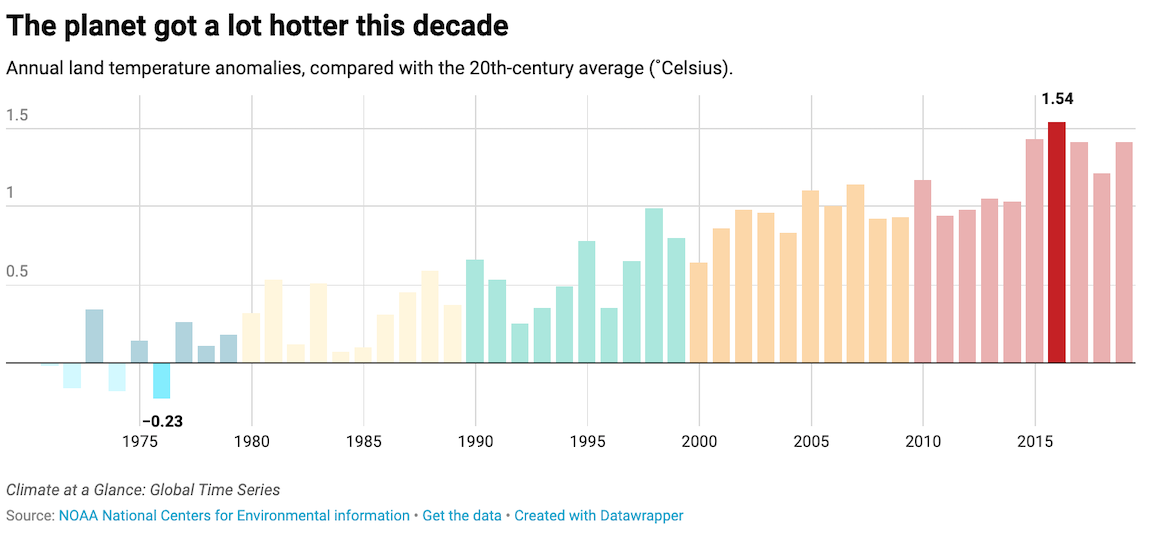
Decades of rising emissions continued to do what scientists have long warned they would: make the world hotter.
In early December, the World Meteorological Organization announced that 2019 is likely to be the second or third warmest on record, capping a “decade of exceptional global heat.” Average temperatures for the preceding five- and 10-year periods will almost certainly be the highest on record.
This chart, using data from the National Oceanic and Atmospheric Administration, clearly highlights the rise in global land temperatures above the 20th-century average. Note the particularly pronounced increase in the last 10 years.
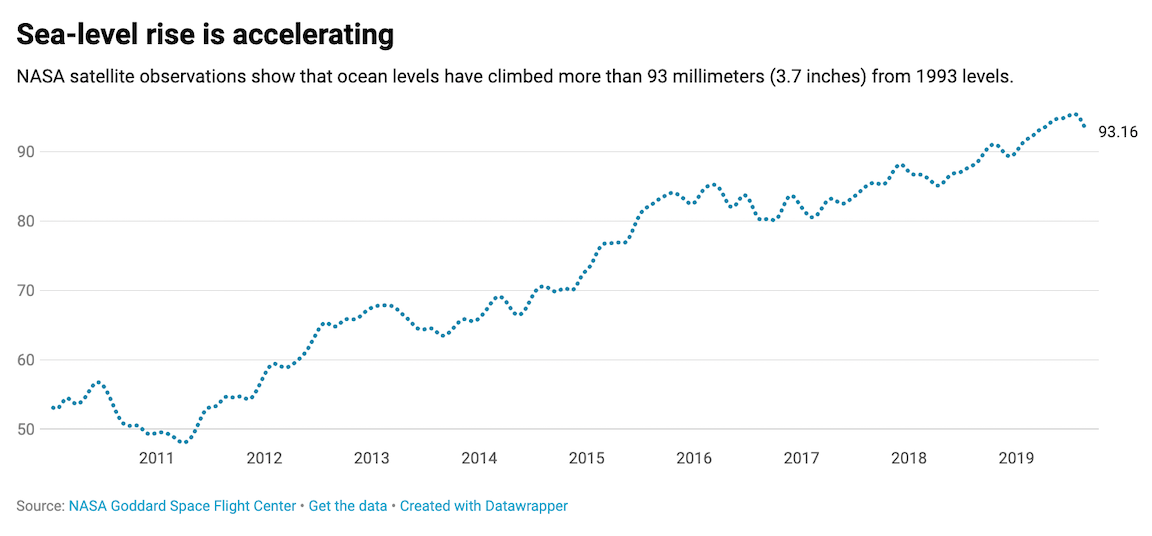
Ocean temperatures rose as well, and warmer water expands. That plus the accelerating loss of ice sheets and glaciers pushed up ocean levels further, as this chart from NASA satellite data highlights.
Indeed, the 2010s mark the decade when the impacts from climate change became unmistakable, at least for any objective-minded observer. As temperatures rose, Arctic sea ice melted far faster than models had predicted. The world’s coral reefs suffered widespread and devastating bleaching events. And regions around the world grappled with some of the costliest, deadliest, and most extreme droughts, hurricanes, heat waves, and wildfires in recorded history.
Since carbon dioxide takes years to reach its full warming effect, and we have yet to even begin cutting emissions, we’ll face even starker dangers in the coming decade.
